Backtesting Microstructure Strategies
Recently, I worked on market microstructure simulation to backtest a HFT strategy. In this post, I will show you how to build a simple but effective simulator. Hope you find it helpful.
Goal
In the past, I worked on strategies whose inputs are based on OHLC candles, but developing microstructure based strategies requires microstructure level simulation: post LOs to historical orderbook states, replay subsequent events and get execution info.
The first simulator: Poisson Process
Avellaneda-Stoikov’s model of orderflow intensity is used to estimate probability of execution. It doesn’t simulate microstructure but works for backtests. The model is based on market dynamics and requires 2 parameters that can be estimated using tick data.
The idea is: arrival rate of MOs matching posted depth \(\delta\) at time \(t\) iis modeled by a Poisson Process with intensity
\[\begin{align} \lambda(t, \delta) &= \alpha(t) P(\Delta p > \delta) \\ &= \alpha(t) e^{-\mu \delta} \end{align}\]where \(\alpha(t)\) is the current fill probability at best price, the arrival rate of MO at time \(t\) and \(P(\Delta p > \delta)\) is probability that the size of the MO would be greater than the size of all LOs of price less than \(\delta\) combined. To see how it is derived you need to look at bottom left of page 220.
Note: the parameters \(\alpha(t)\) and \(\mu\) are estimated for each of 10 minute segments in backtest period.
The binary \(x \in [fill, no fill]\) is sampled from a Bernoulli distribution: \(B(\lambda(t, \delta)\Delta)\) where \(\Delta\) is the strategy-dependent maximum time interval before cancellation.
It’s very fast to compute - it takes ~20 seconds to backtest a month’s data using 32 threads on a Threadripper 1950X. However, some LOs had questionable fills in some scenarios I visualized. So I decided to build a real orderbook microstructure simulator.
The second simulator: SimBook
I implemented a market simulator called SimBook based on a flowchart from Robert Almgren’s slides which was very helpful(thank you!).
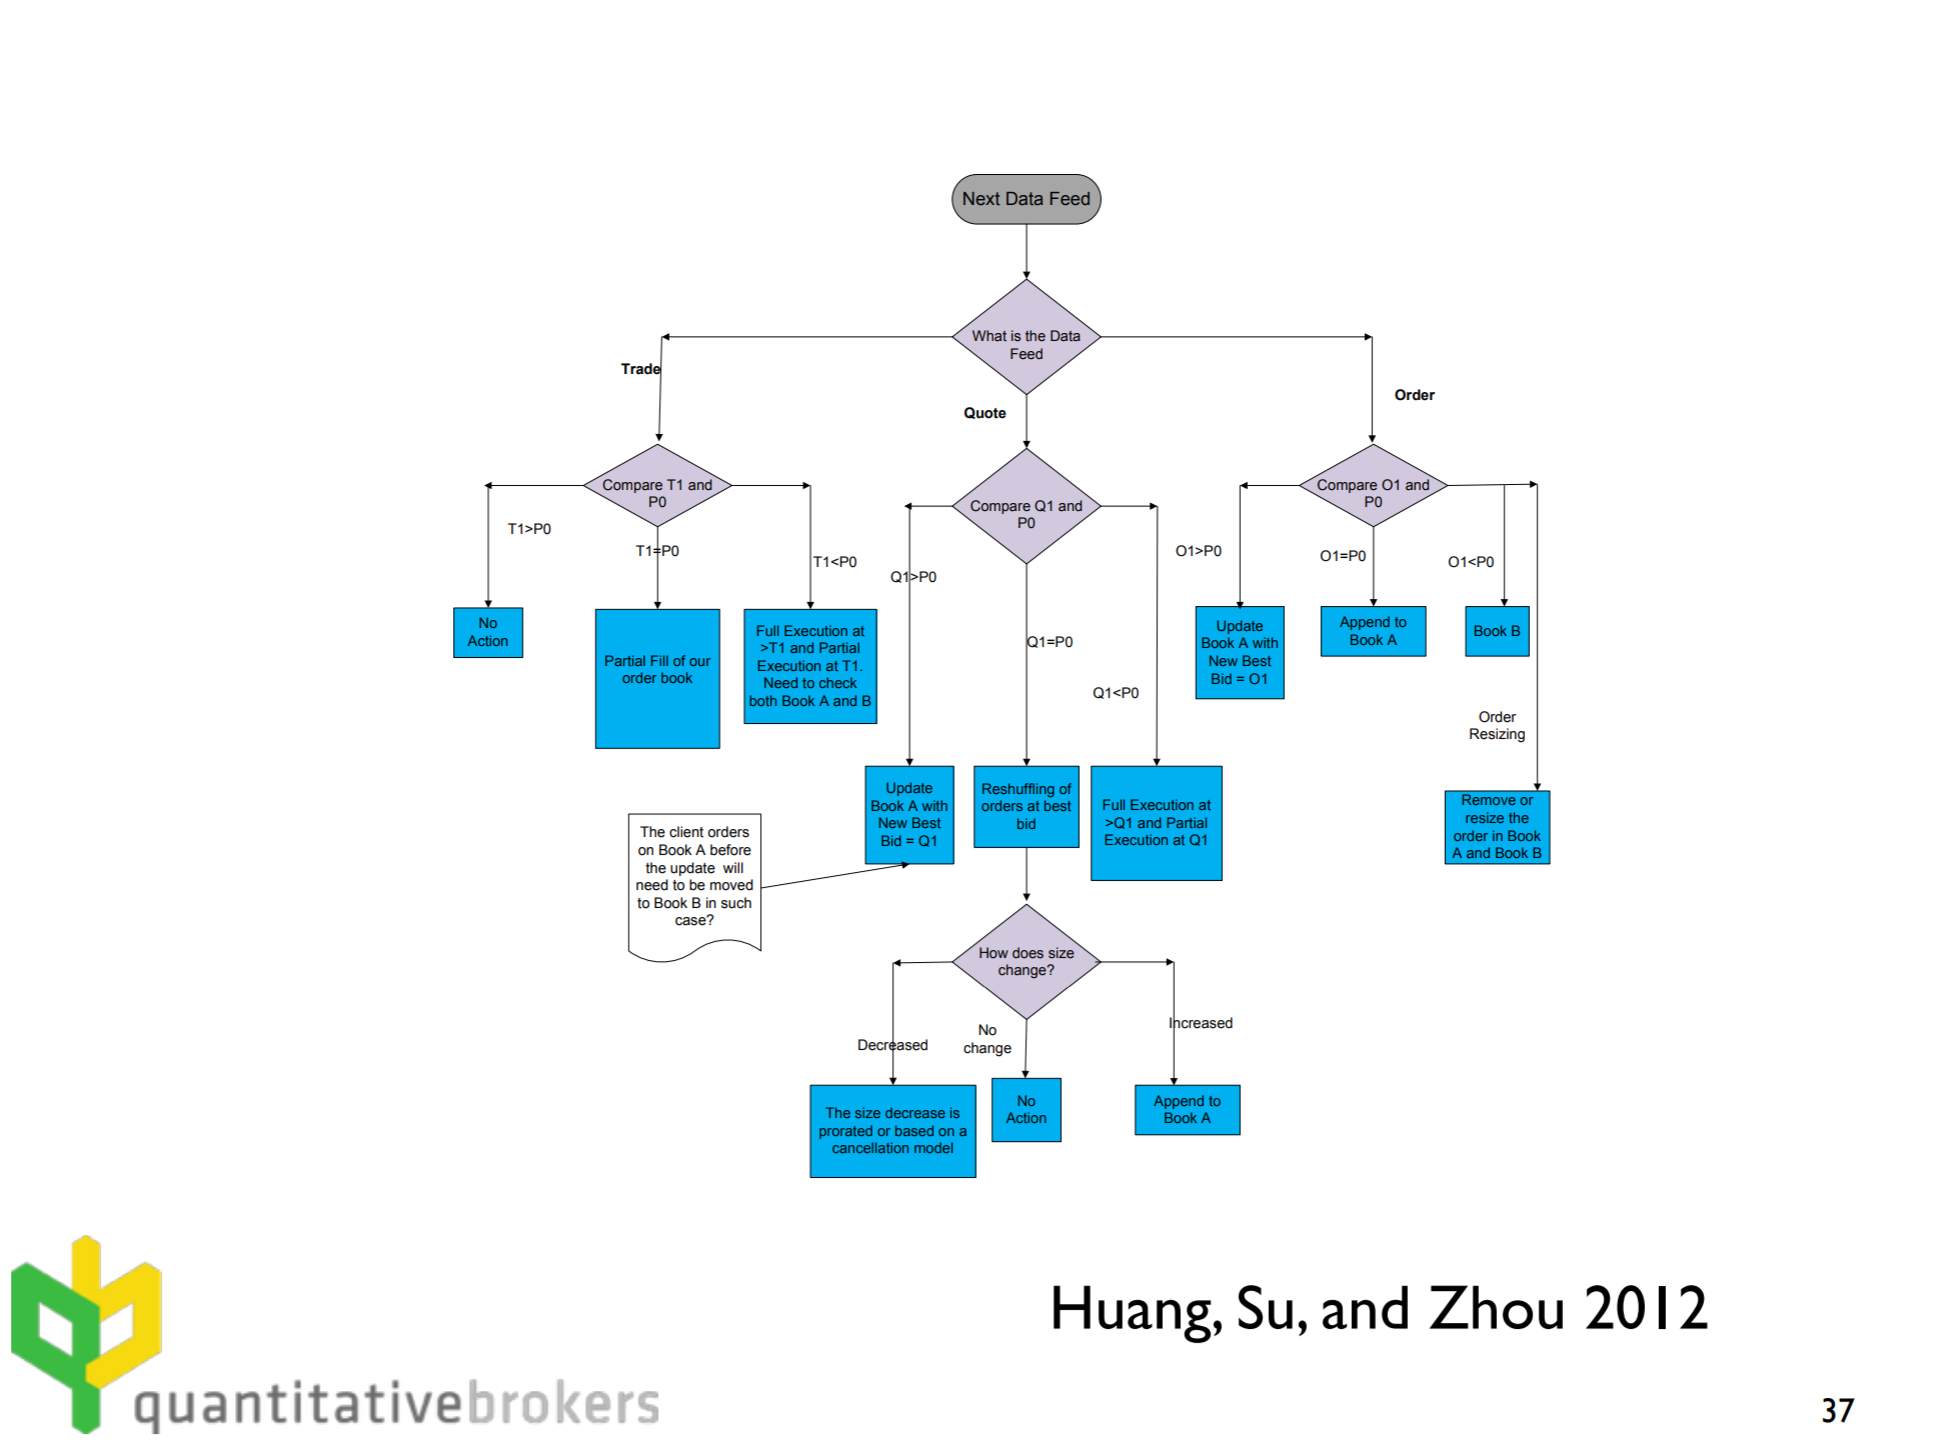
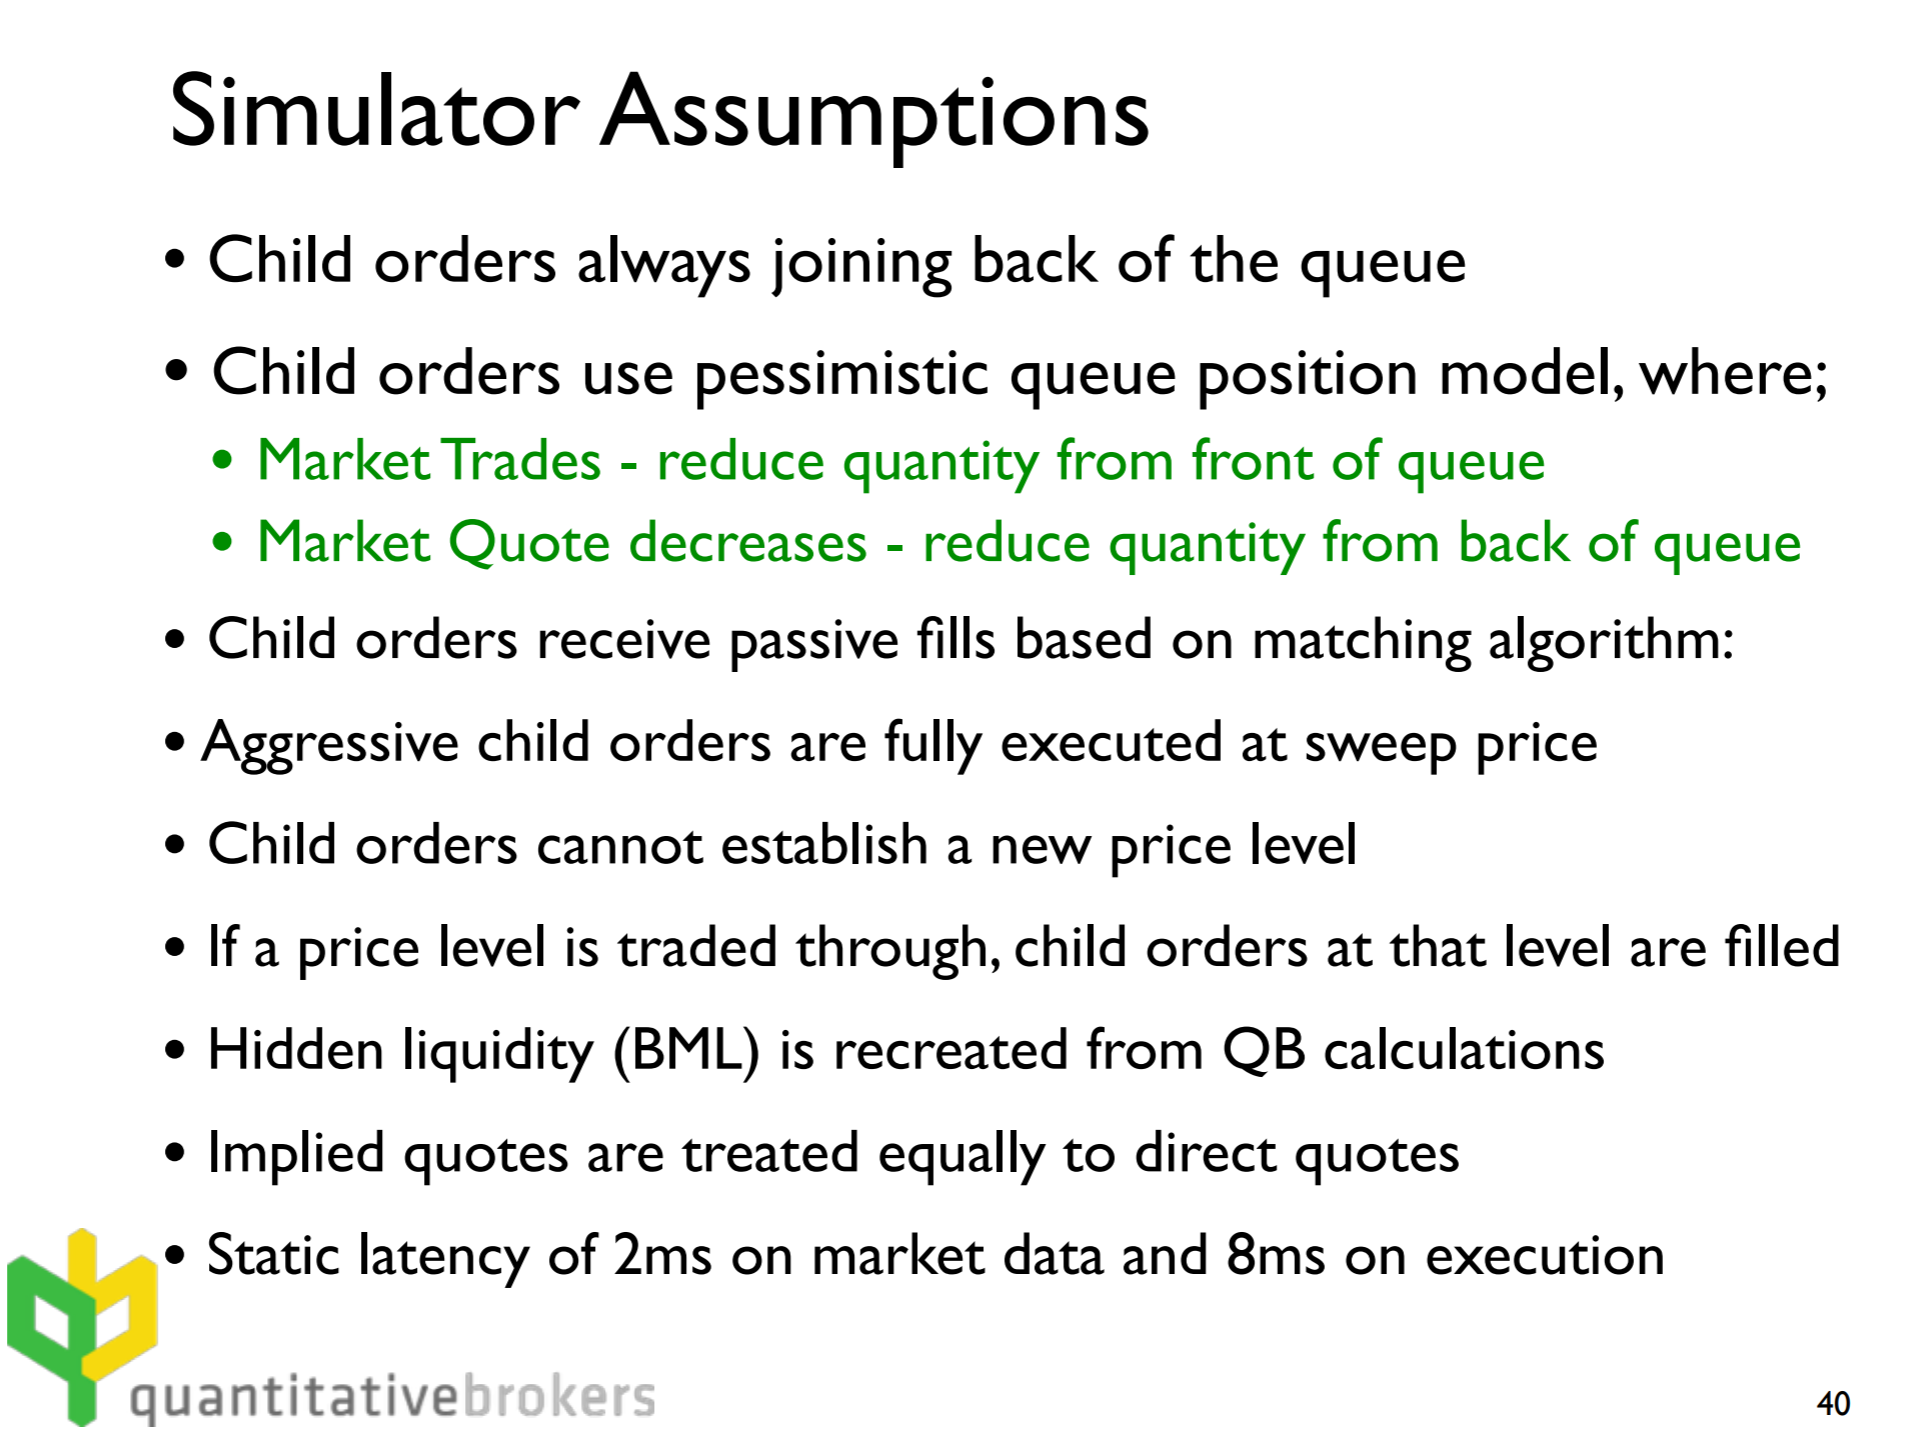
The idea is to build an orderbook matching engine that follows a set of pessimistic exchange matching rules.
Since I couldn’t find the original paper “Combining historical data with a market simulator for testing algorithmic trading” (presumably because it was a term paper for a course hence never published), it was hard to understand some of the rationale behind these design decisions but it was mostly self-explanatory.
For my implementation, I relaxed some assumptions but they don’t affect realism too much. For example, simulated orders are allowed to establish new price levels as long as they are worse than bba. I also implemented some heuristics for maximum order size and latency restrictions which makes it slightly more realistic.
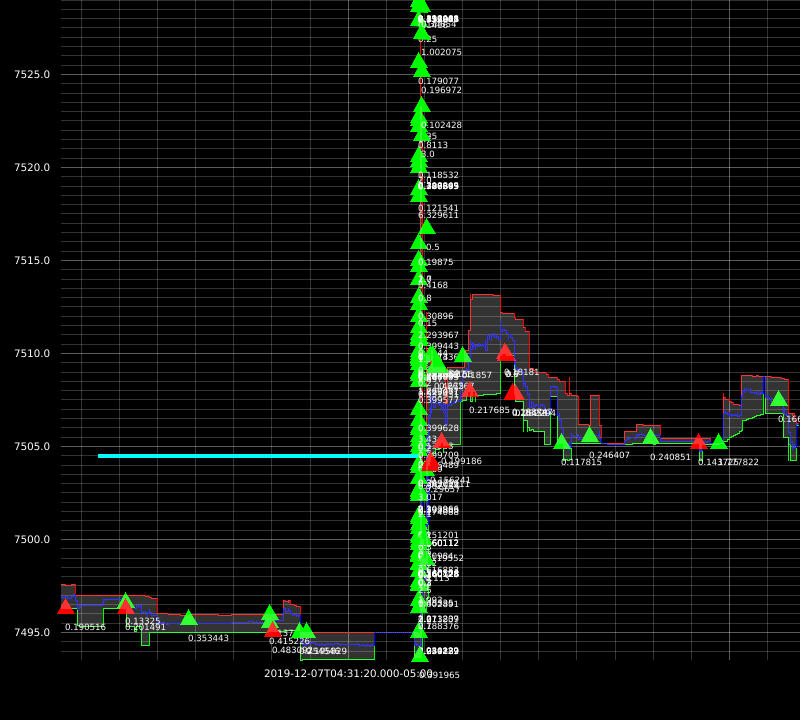
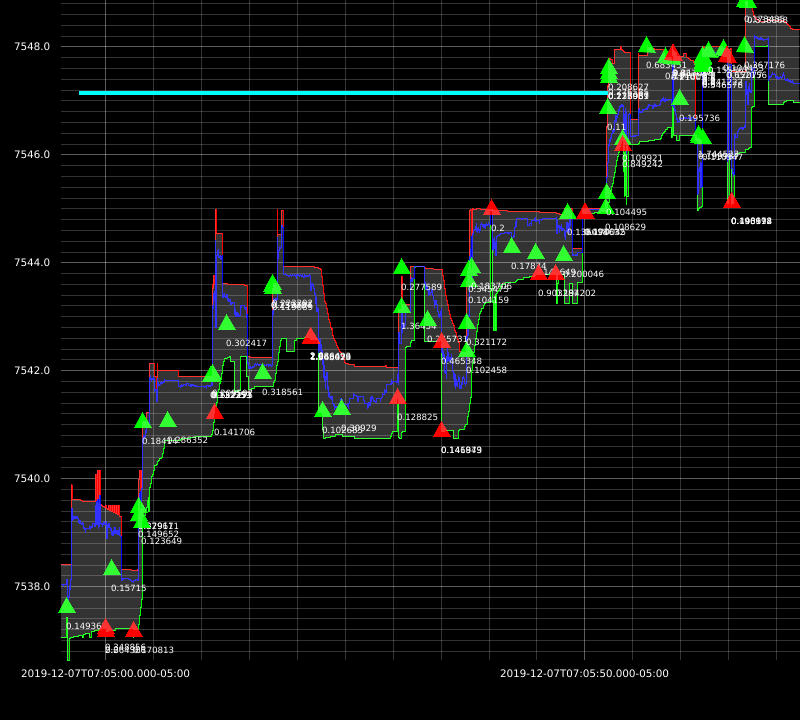
I was able to achieve great results with this approach. Here are some example executions from my backtests:
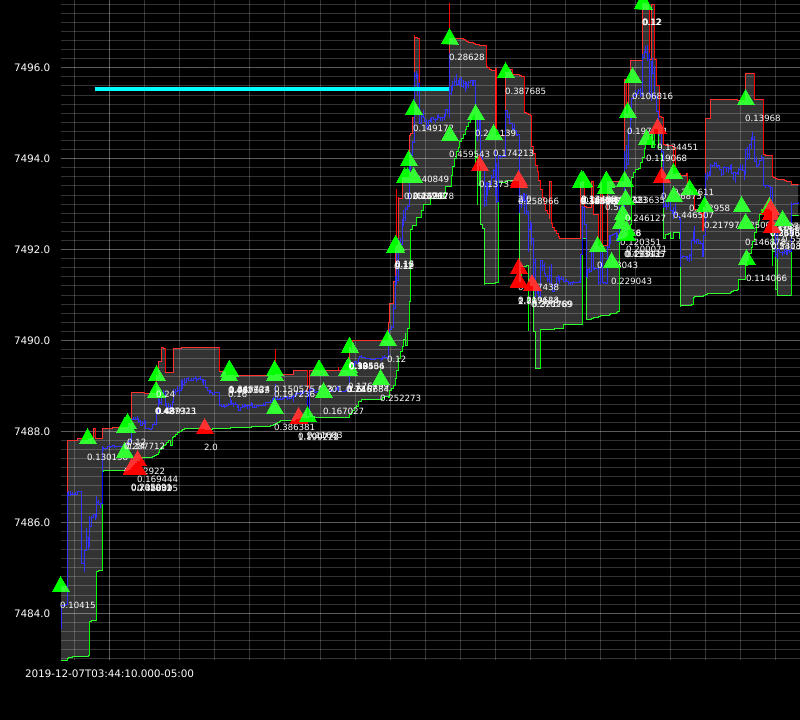
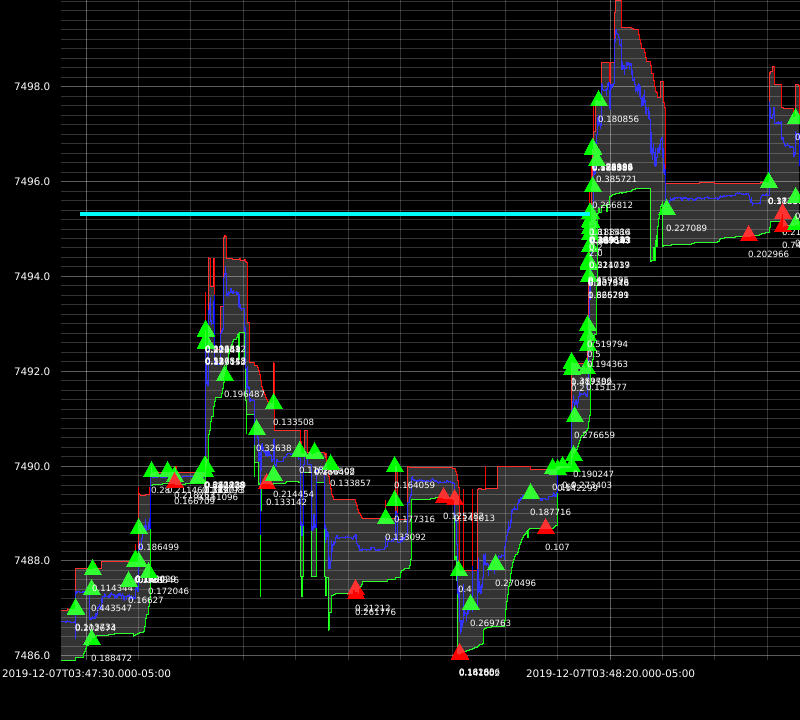
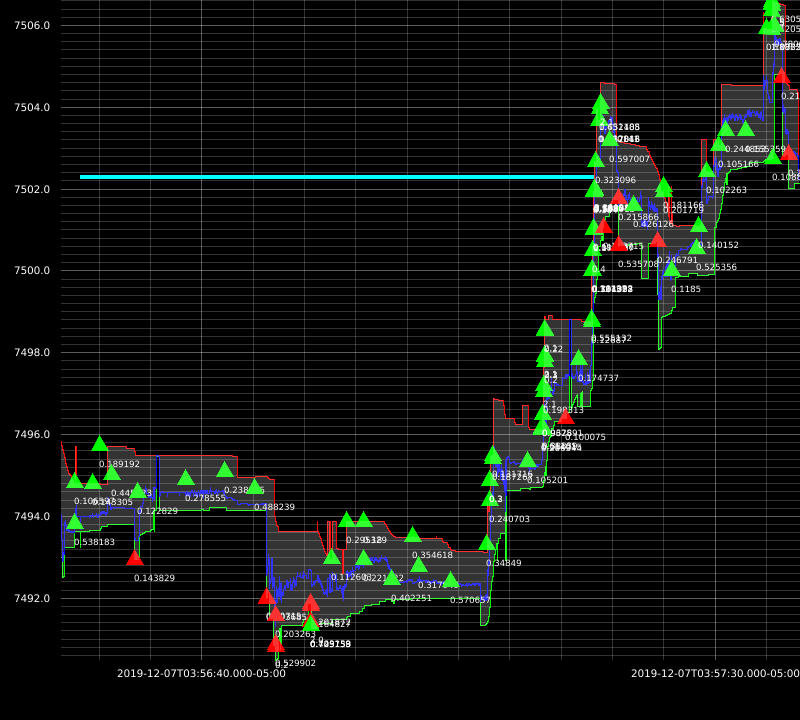
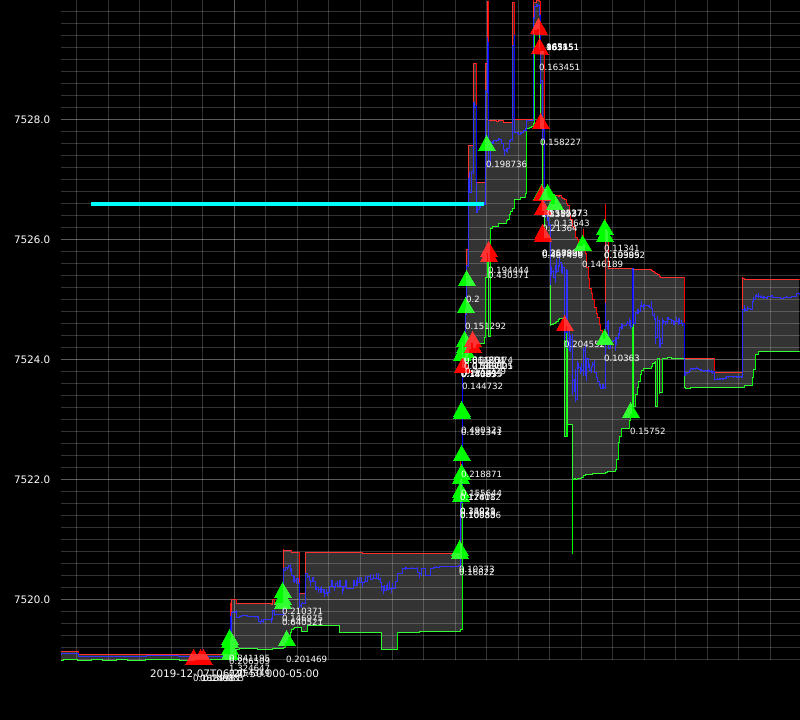
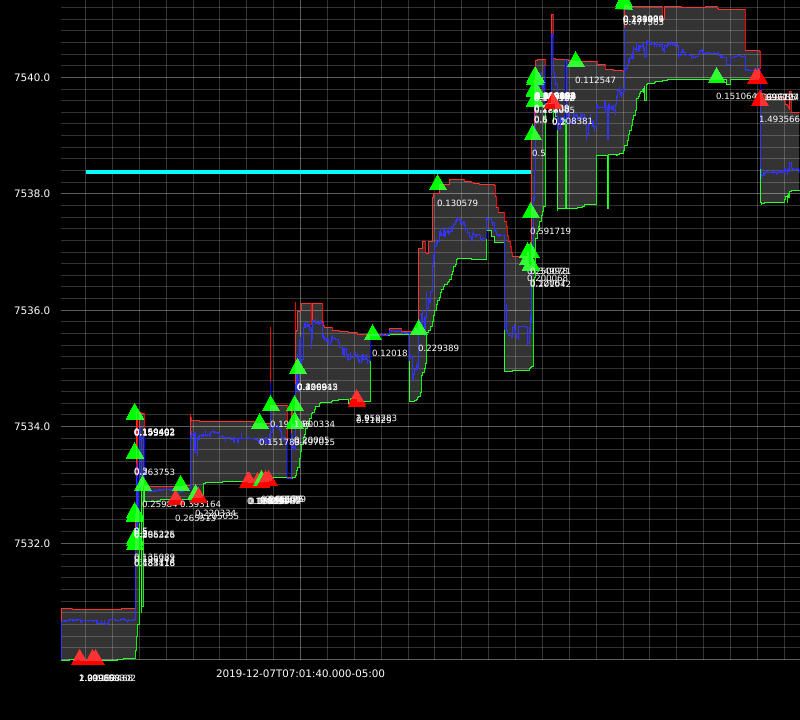
The downside of this approach is: market impact not being taken into account. At this time, my strategies are dumb so I don’t need more sophisticated simulators just yet.
The third simulation: Queue-Reactive Model
This one I did not implement but explored in depth. I got inspired to develop a signal that uses Kalman filter to estimate the implicit spread. I will explain this in a separate blog post.
References
https://www.math.nyu.edu/faculty/avellane/HighFrequencyTrading.pdf
http://stanford.edu/class/msande448/2018/Final/Reports/gr5.pdf
https://arxiv.org/pdf/1312.0563.pdf
http://www.math.ualberta.ca/~cfrei/PIMS/Almgren5.pdf
https://quant.stackexchange.com/questions/38781/backtesting-market-making-strategy-or-microstructure-strategy
https://www.amazon.com/Algorithmic-High-Frequency-Trading-Mathematics-Finance/dp/1107091144